Harness the power of Satellite data for your business
From precision agriculture and urban planning to forestry management and mine monitoring—access multi-sensor imagery, analytics, and forecasts through our APIs.

From precision agriculture and urban planning to forestry management and mine monitoring—access multi-sensor imagery, analytics, and forecasts through our APIs.
Our platform offers a comprehensive suite of tools to analyze and visualize satellite imagery data
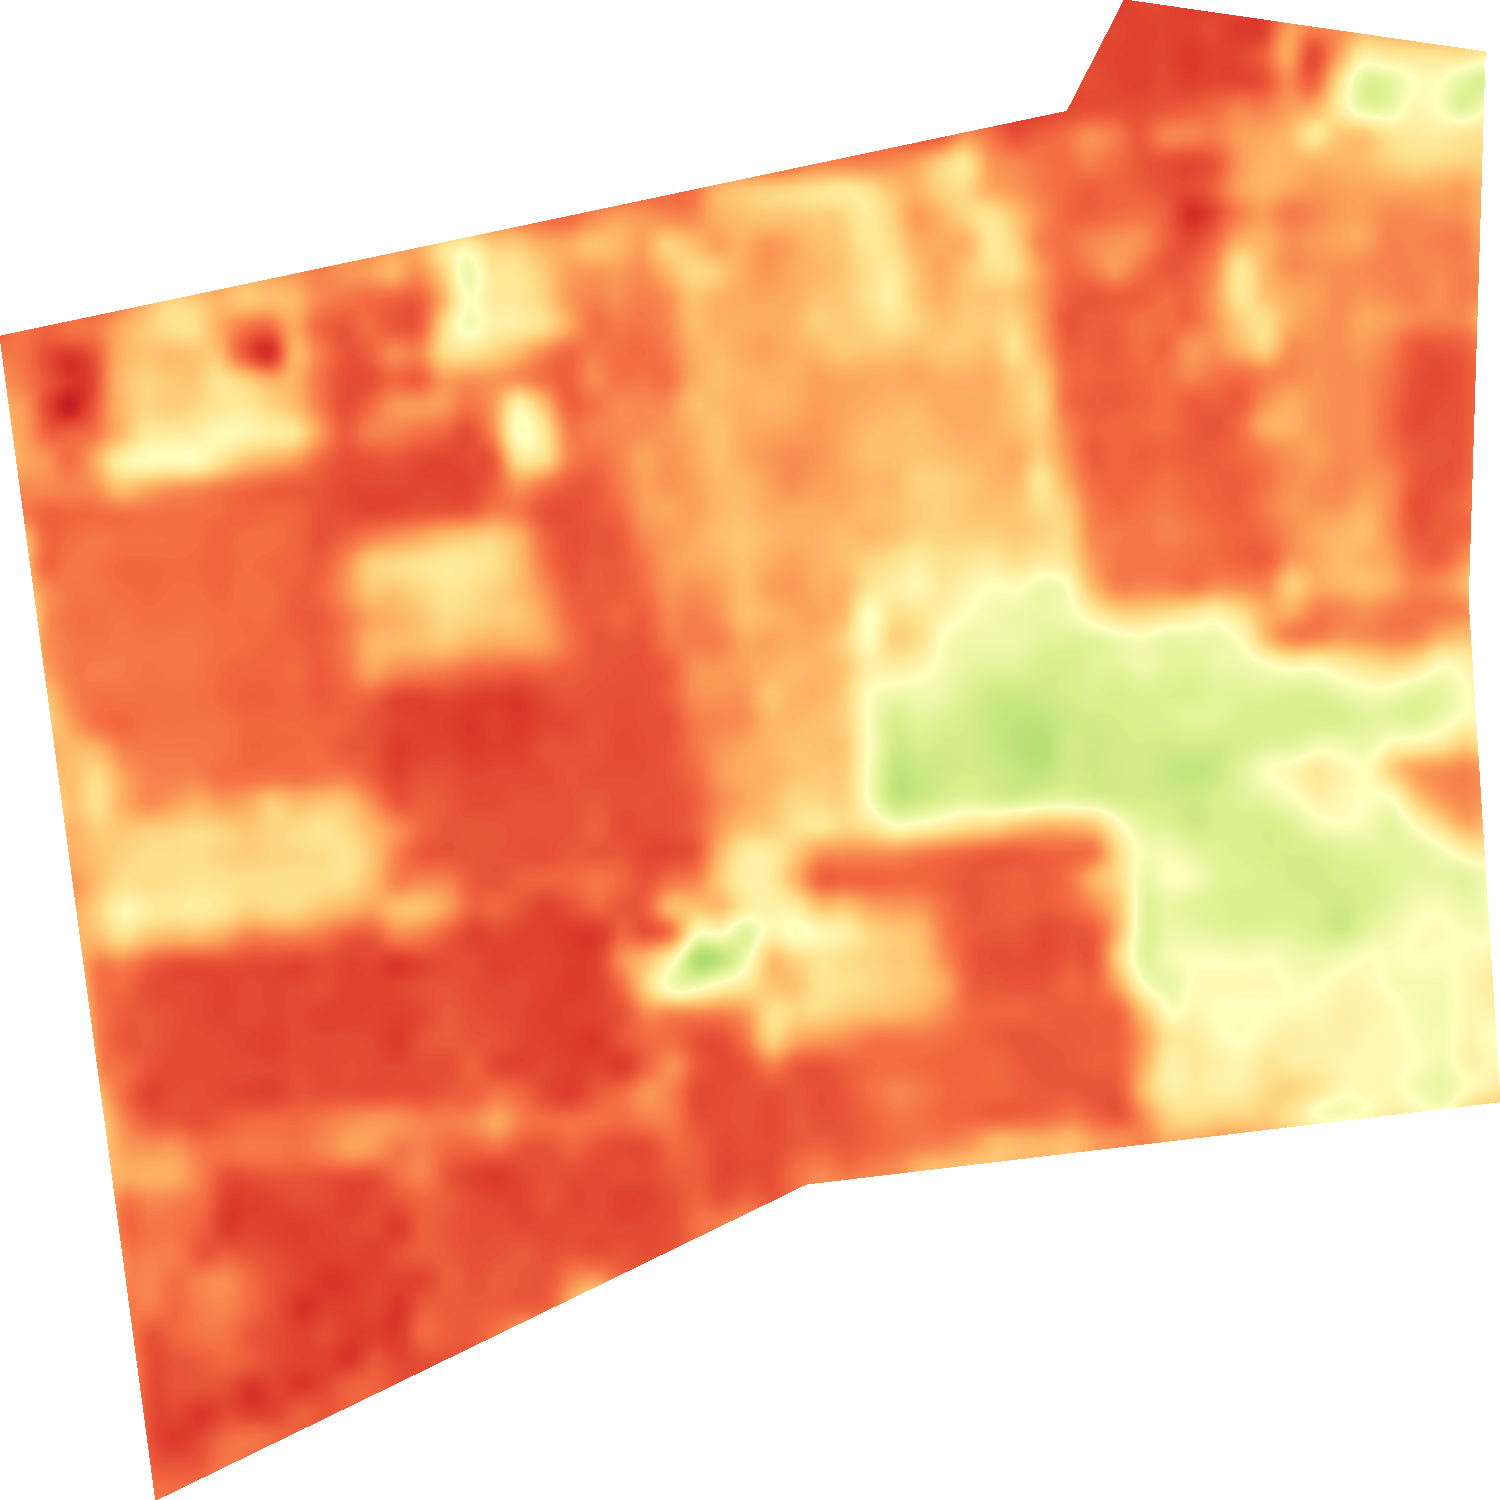
Calculate 50+ vegetation indices from multiple satellites to monitor health and environmental changes.
Access Images in multiple formats along with statistical data from 2010 onwards for any size of Area of Interest
Access comprehensive weather data including current conditions, forecasts, and historical records for any location worldwide.
Define custom areas of interest and receive automated analytics for your specific regions.
Export your analysis results in various formats including GeoTIFF, PNG, and CSV for further processing.
Allow custom indices as well as color pallete to make unique results suitable to your use case.
Unlock the power of satellite imagery and advanced data science with our ready-to-deploy remote sensing solutions. Our platform offers real-time monitoring and actionable insights for agriculture, forestry, and environmental management. From detecting stubble burning and deforestation to automated field segmentation and yield prediction—our tools are designed to scale from individual farms to entire regions.
Leverage high-resolution imagery and trusted satellite sources including Sentinel-1, Sentinel-2, Landsat, Maxar, Axelspace, and BlackSky. Our robust processing engine enables fast and accurate analysis for applications such as water stress detection, land use/land cover (LULC) classification, SAR-based object detection, and comprehensive change detection for both vegetation and urban development.
Explore Analytics Explore Indices
See how our platform stacks up against other satellite imagery solutions
| Features | ObservEarth | Google Earth Engine | Agromonitoring |
|---|---|---|---|
|
User-friendly Interface
ObservEarth: Yes
GEE: No
Agromonitoring: Limited
|
Intuitive dashboard
|
Requires coding knowledge
|
Basic interface with limitations
|
|
Indices Support
ObservEarth: 50+
GEE: Many
Agromonitoring: Limited
|
50+ ready-to-use indices
|
Extensive but requires coding
|
Limited selection
|
|
Historical Data Access
ObservEarth: Since 2010
GEE: Extensive
Agromonitoring: Limited
|
Complete data from 2010 onwards
|
Extensive historical archives
|
Limited historical period
|
|
API Access
ObservEarth: Simple
GEE: Complex
Agromonitoring: Yes
|
Simple, well-documented REST API
|
Complex API structure
|
Basic API functionality
|
|
Customization Support
ObservEarth: Yes
GEE: With coding
Agromonitoring: No
|
Full customization options
|
Requires coding knowledge
|
Limited customization
|
|
Soil & Weather Data
ObservEarth: Yes
GEE: With coding
Agromonitoring: Limited
|
Comprehensive soil & weather analytics
|
Available with custom coding
|
Basic weather data only
|
|
Ready ML Algorithms
ObservEarth: Yes
GEE: With coding
Agromonitoring: No
|
Pre-built ML models ready to use
|
Requires custom implementation
|
Not available
|
|
Pricing & License
ObservEarth: Affordable
GEE: Free (non-commercial)
Agromonitoring: Expensive
|
Affordable
Commercial use allowed
|
Free
Non-commercial use only
|
Premium
Commercial use allowed
|
|
Learning Curve
ObservEarth: Low
GEE: High
Agromonitoring: Medium
|
Low
Intuitive for beginners
|
High
Requires programming skills
|
Medium
Some technical knowledge needed
|
Join thousands of users who are already leveraging our platform to monitor and analyze Earth observation data. Sign up today and start exploring the power of satellite analytics.
Sign Up Now